Types#
- ridgeplot._types.CollectionL1#
A
TypeAliasfor a 1-level-deepCollection.Example:
>>> c1 = [1, 2, 3]
alias of
Collection[_T]
- ridgeplot._types.CollectionL2#
A
TypeAliasfor a 2-level-deepCollection.Example:
>>> c2 = [[1, 2, 3], [4, 5, 6]]
alias of
Collection[Collection[_T]]
- ridgeplot._types.CollectionL3#
A
TypeAliasfor a 3-level-deepCollection.Example:
>>> c3 = [
...     [[1, 2], [3, 4]],
...     [[5, 6], [7, 8]],
... ]
alias of
Collection[Collection[Collection[_T]]]
- class ridgeplot._types.NumericT#
A
TypeVarvariable bound toNumerictypes.alias of TypeVar(‘NumericT’, bound=
Union[int,integer,float,floating])
- ridgeplot._types._is_numeric(obj: Numeric) Literal[True][source]#
- ridgeplot._types._is_numeric(obj: Any) bool
Check if the given object is a
Numerictype.
- ridgeplot._types.XYCoordinate#
A 2D \((x, y)\) coordinate, represented as a
tupleof twoNumericvalues.Example:
>>> xy_coord = (1, 2)
- ridgeplot._types.DensityTrace#
A 2D line/trace represented as a collection of \((x, y)\) coordinates (i.e.
XYCoordinates).These are equivalent:
DensityTraceCollectionL1[XYCoordinate]Collection[Tuple[Numeric, Numeric]]
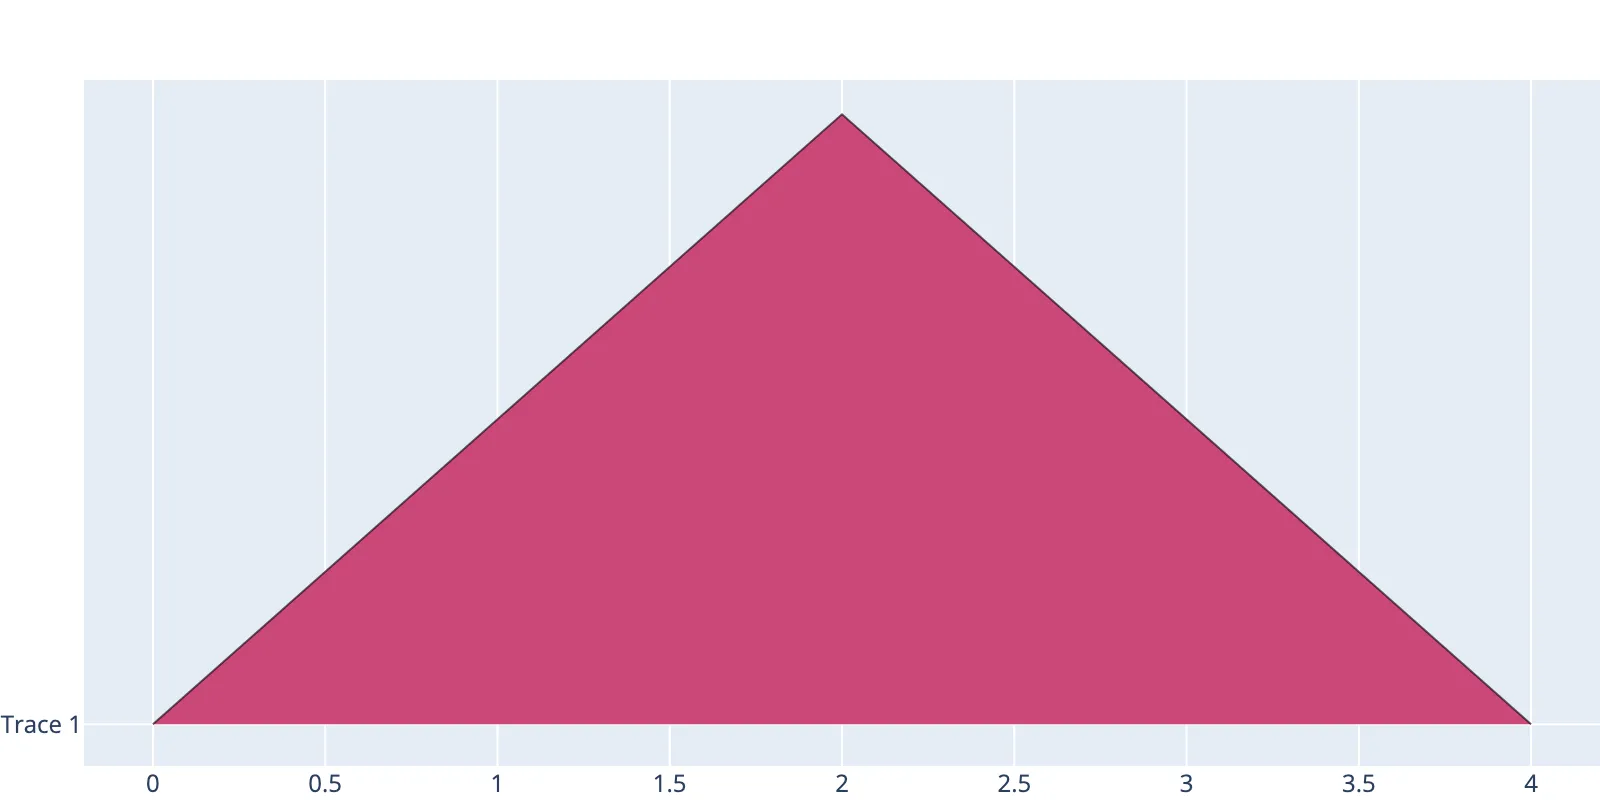
By convention, the \(x\) values should be non-repeating and increasing. For instance, the following is a valid 2D line trace:
>>> density_trace = [(0, 0), (1, 1), (2, 2), (3, 1), (4, 0)]
alias of
Collection[Tuple[NumericT,NumericT]]
- ridgeplot._types.DensitiesRow#
A
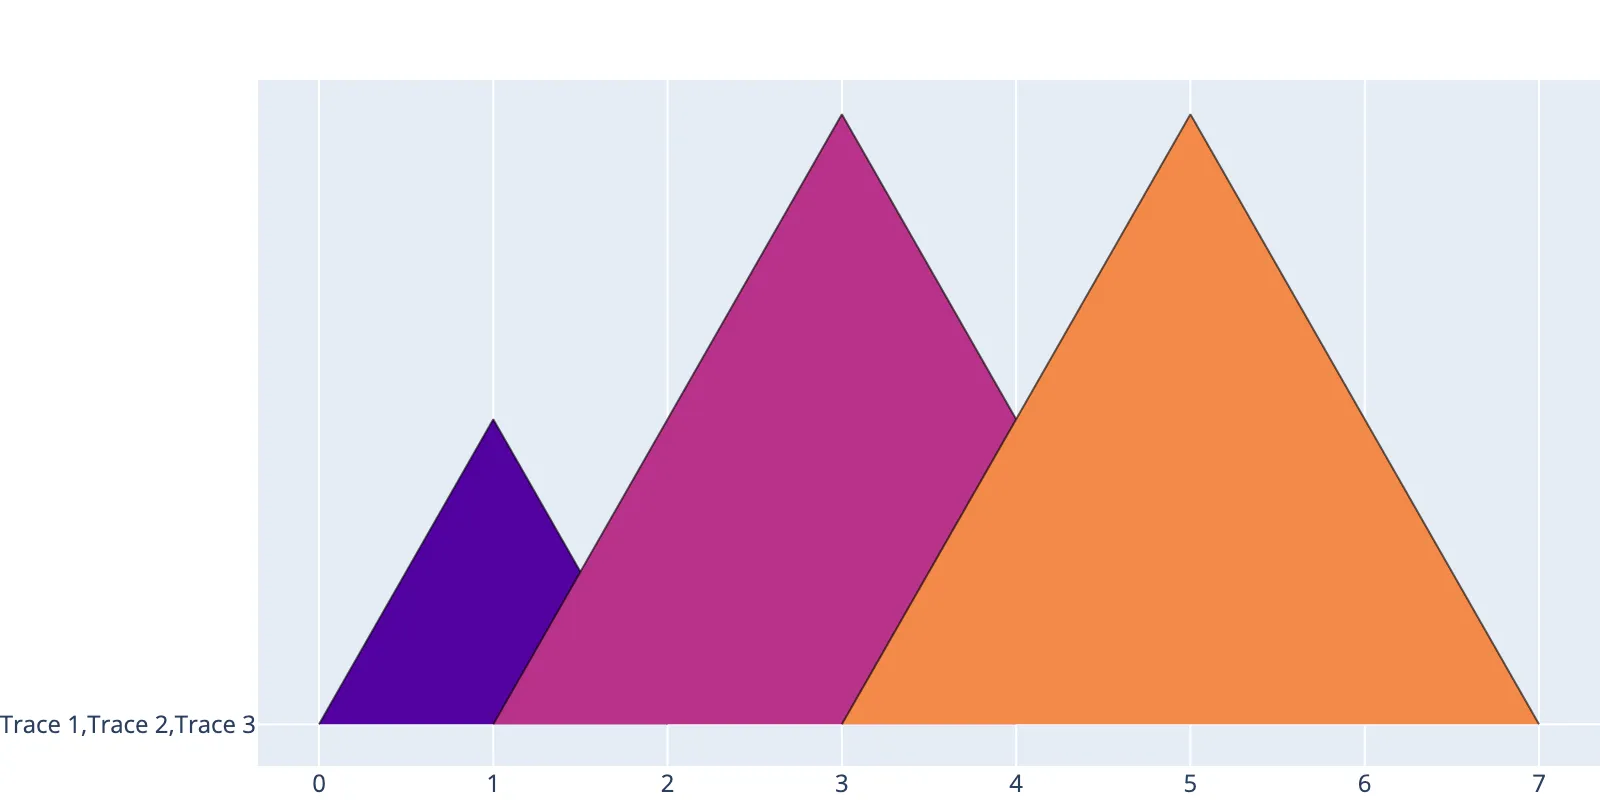
DensitiesRowrepresents a set ofDensityTraces that are to be plotted on a given row of a ridgeplot.These are equivalent:
DensitiesRowCollectionL2[XYCoordinate]Collection[Collection[Tuple[Numeric, Numeric]]]
Example:
>>> densities_row = [
...     [(0, 0), (1, 1), (2, 0)],                 # Trace 1
...     [(1, 0), (2, 1), (3, 2), (4, 1)],         # Trace 2
...     [(3, 0), (4, 1), (5, 2), (6, 1), (7, 0)], # Trace 3
... ]
alias of
Collection[Collection[Tuple[NumericT,NumericT]]]
- ridgeplot._types.Densities#
The
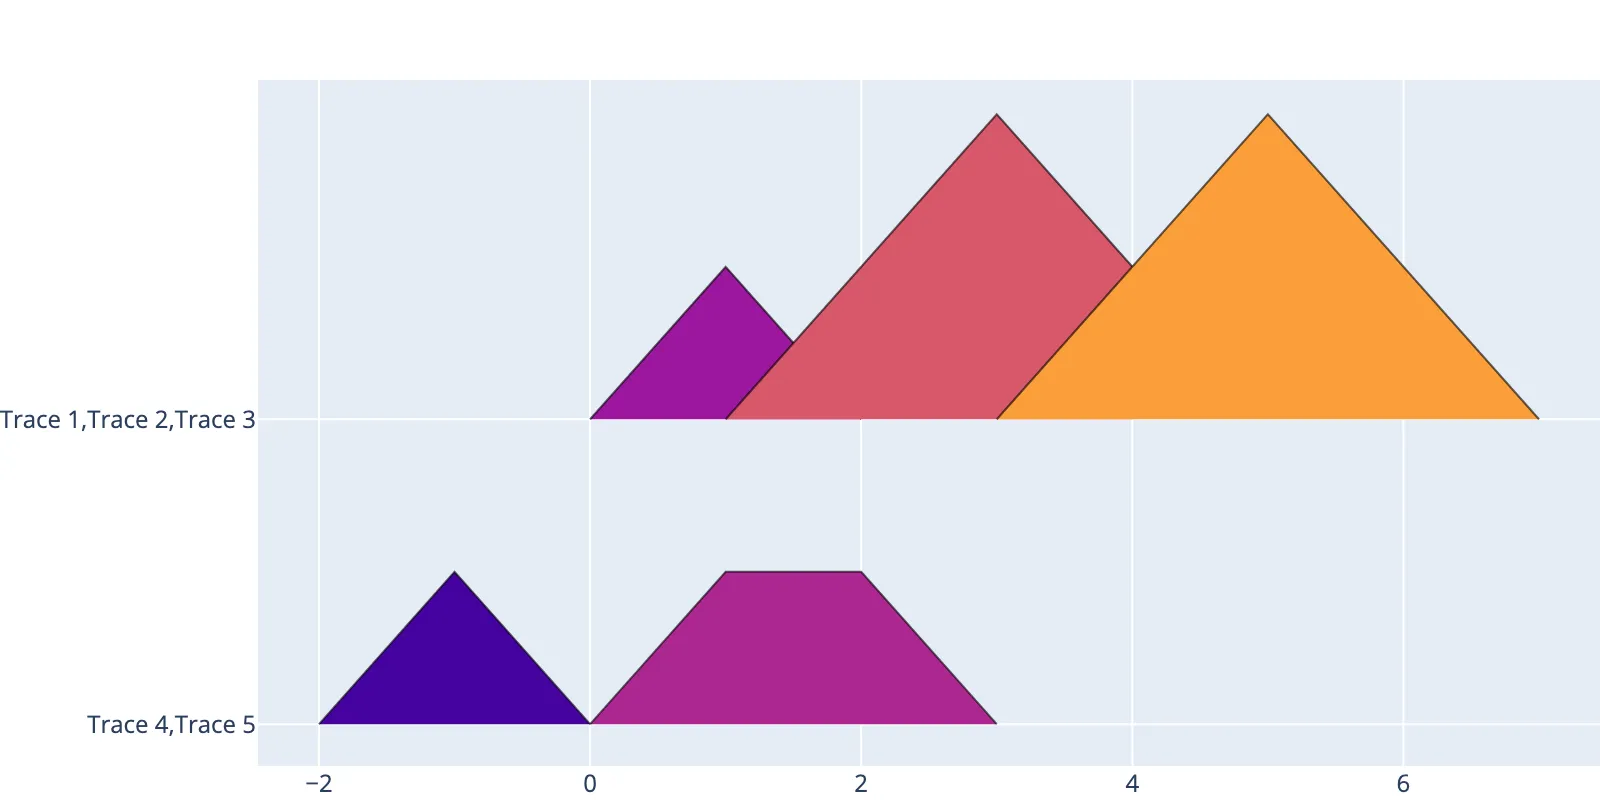
Densitiestype represents the entire collection of traces that are to be plotted on a ridgeplot.In a ridgeplot, several traces can be plotted on different rows. Each row is represented by a
DensitiesRowobject which, in turn, is a collection ofDensityTraces. Therefore, theDensitiestype is a collection ofDensitiesRows.These are equivalent:
DensitiesCollectionL1[DensitiesRow]CollectionL3[XYCoordinate]Collection[Collection[Collection[Tuple[Numeric, Numeric]]]]
For instance, the following is a valid
Densitiesobject:>>> densities = [ ... [ # Row 1 ... [(0, 0), (1, 1), (2, 0)], # Trace 1 ... [(1, 0), (2, 1), (3, 2), (4, 1)], # Trace 2 ... [(3, 0), (4, 1), (5, 2), (6, 1), (7, 0)], # Trace 3 ... ], ... [ # Row 2 ... [(-2, 0), (-1, 1), (0, 0)], # Trace 5 ... [(0, 0), (1, 1), (2, 1), (3, 0)], # Trace 6 ... ], ... ]
alias of
Collection[Collection[Collection[Tuple[NumericT,NumericT]]]]
- ridgeplot._types.ShallowDensities#
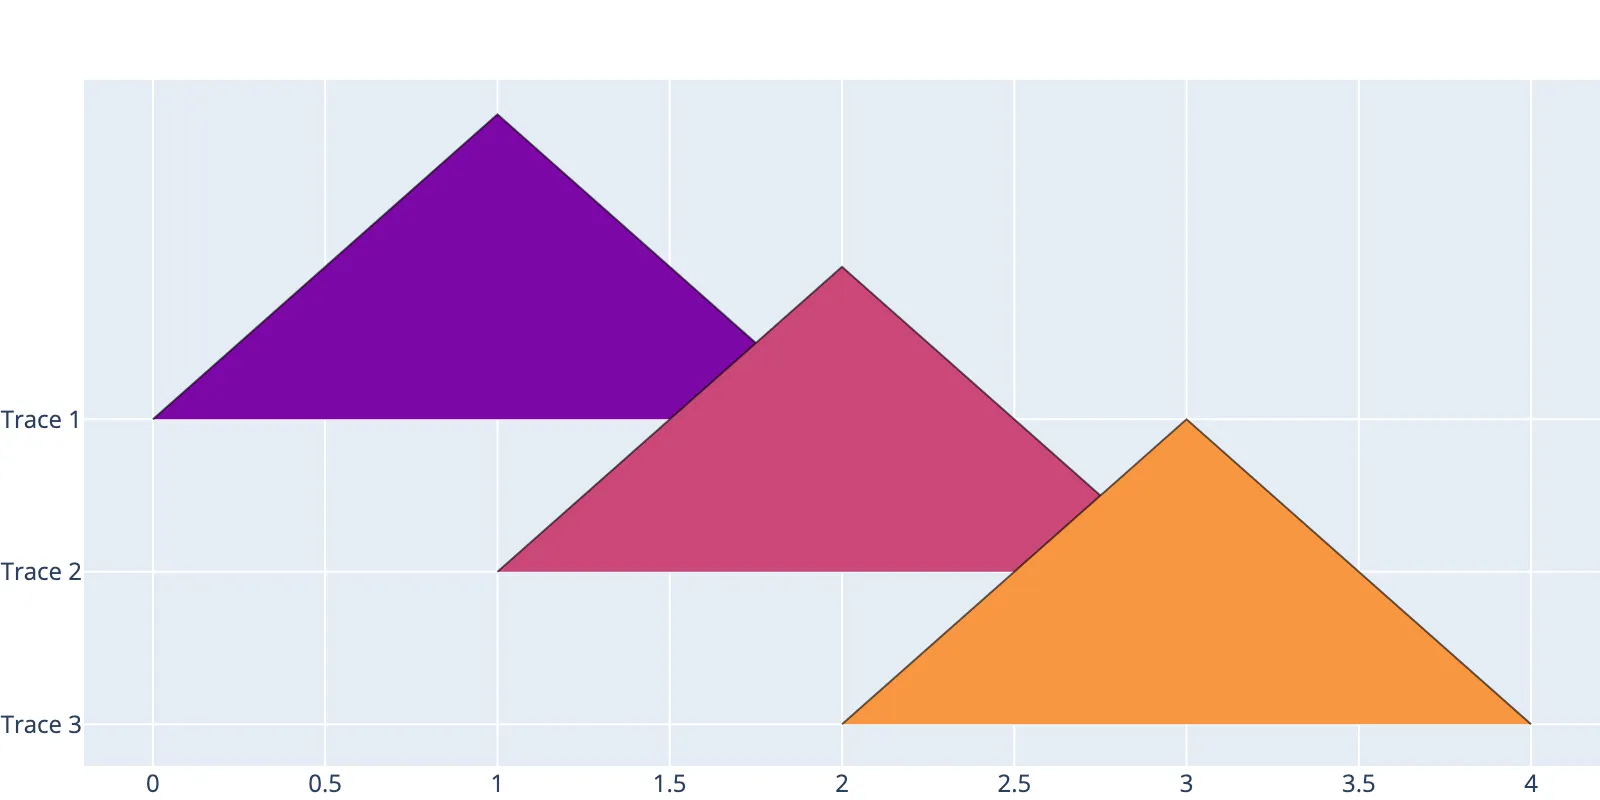
Shallow type for
Densitieswhere each row of the ridgeplot contains only a single trace.These are equivalent:
DensitiesCollectionL1[DensityTrace]CollectionL2[XYCoordinate]Collection[Collection[Tuple[Numeric, Numeric]]]
Example:
>>> shallow_densities = [
...     [(0, 0), (1, 1), (2, 0)], # Trace 1
...     [(1, 0), (2, 1), (3, 0)], # Trace 2
...     [(2, 0), (3, 1), (4, 0)], # Trace 3
... ]
alias of
Collection[Collection[Tuple[NumericT,NumericT]]]
- ridgeplot._types.is_shallow_densities(obj: ShallowDensities) Literal[True][source]#
- ridgeplot._types.is_shallow_densities(obj: Any) bool
Check if the given object is a
ShallowDensitiestype.
- ridgeplot._types.SamplesTrace#
A
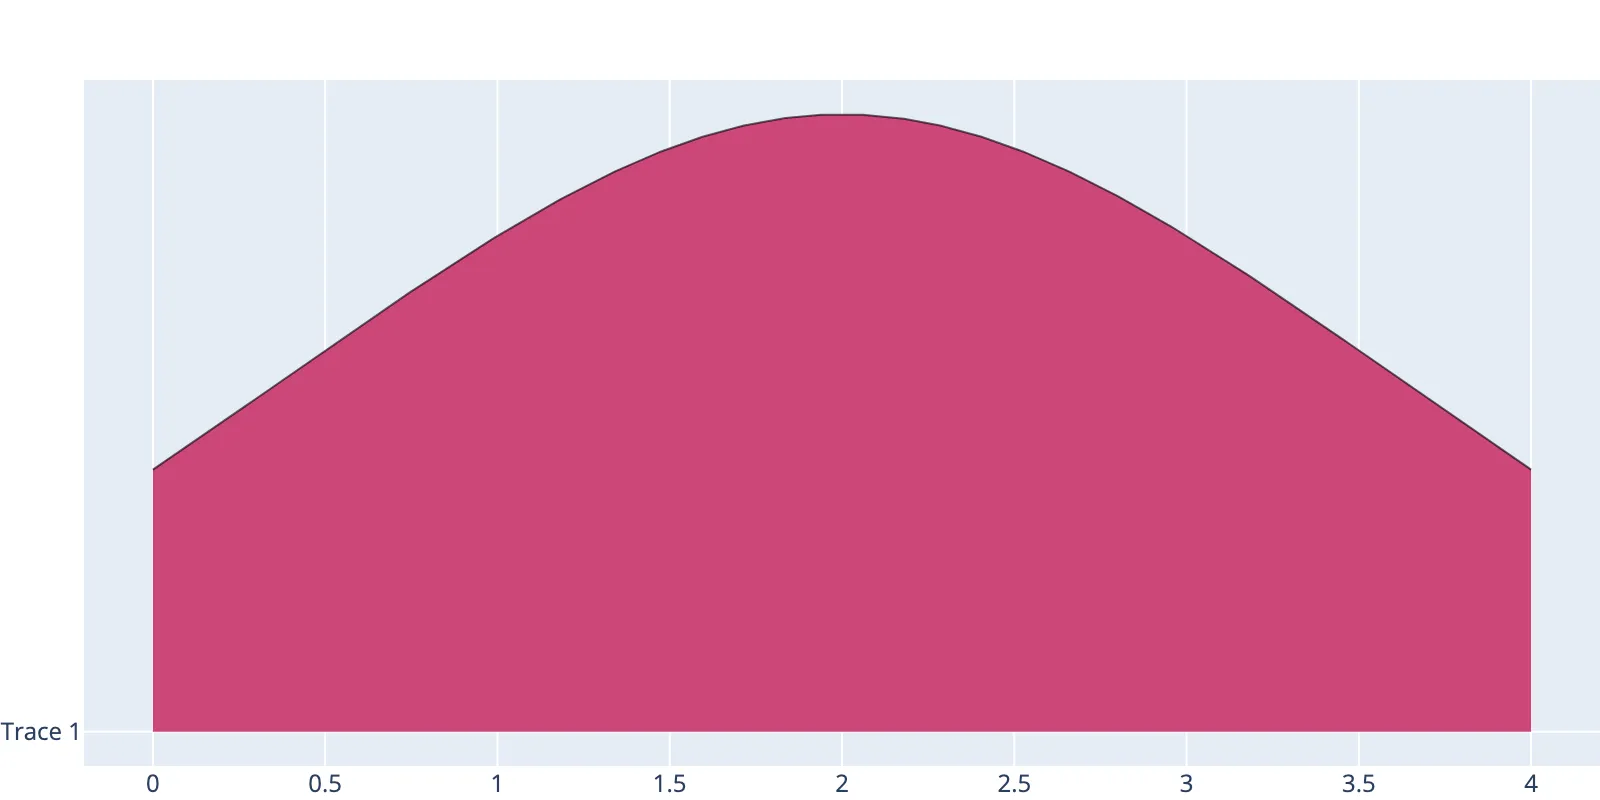
SamplesTraceis a collection of numeric values representing a set of samples from which aDensityTracecan be estimated via KDE.Example:
>>> samples_trace = [0, 1, 1, 2, 2, 2, 3, 3, 4]
- ridgeplot._types.SamplesRow#
A
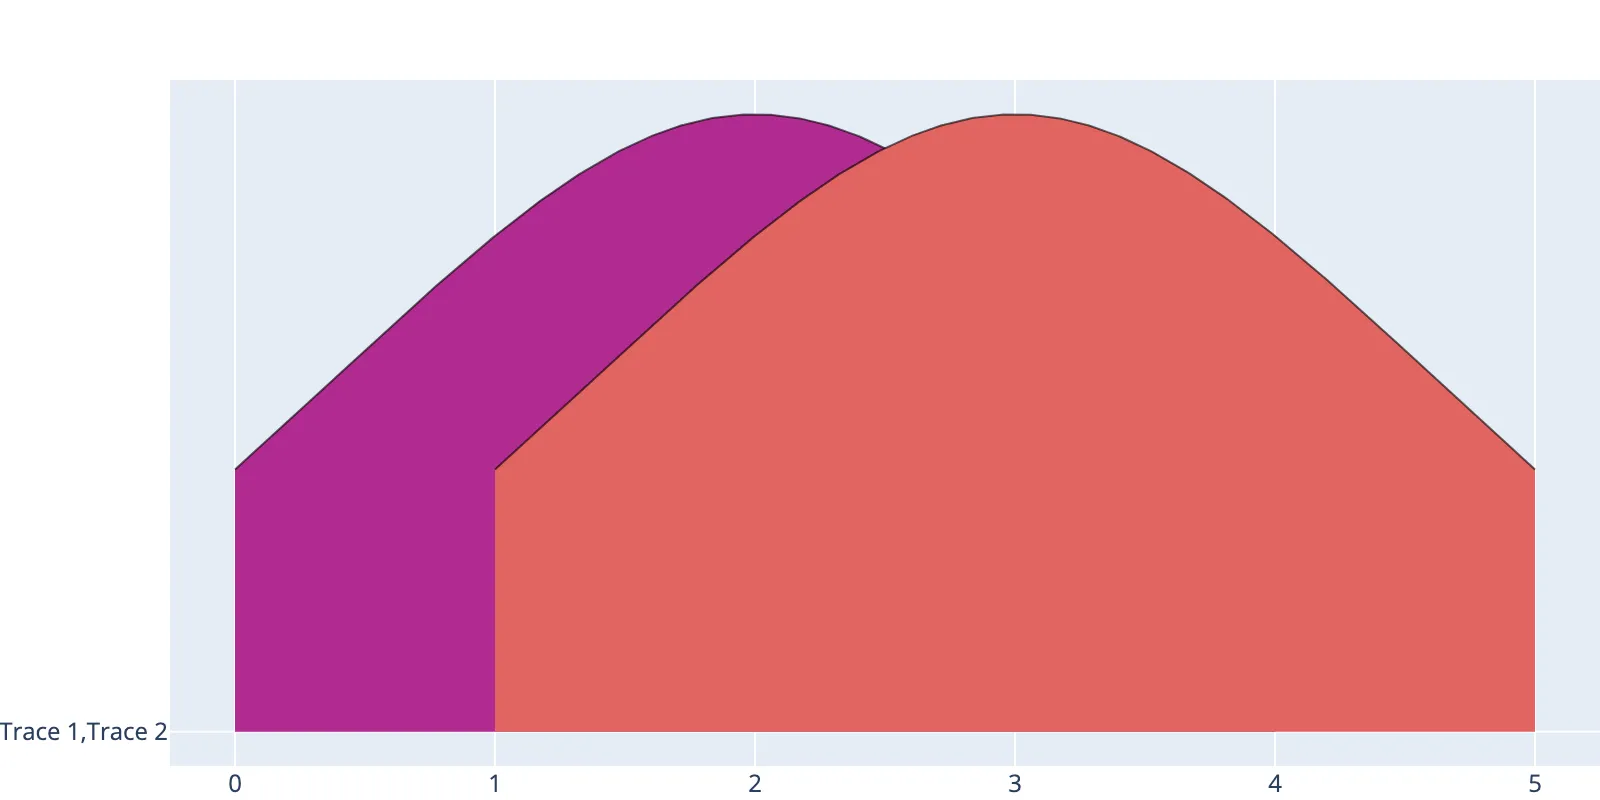
SamplesRowrepresents a set ofSamplesTraces that are to be plotted on a given row of a ridgeplot.i.e. a
SamplesRowis a collection ofSamplesTraces and can be converted into aDensitiesRowby applying KDE to each trace.Example:
>>> samples_row = [
...     [0, 1, 1, 2, 2, 2, 3, 3, 4], # Trace 1
...     [1, 2, 2, 3, 3, 3, 4, 4, 5], # Trace 2
... ]
alias of
Collection[Collection[Union[int,integer,float,floating]]]
- ridgeplot._types.Samples#
The
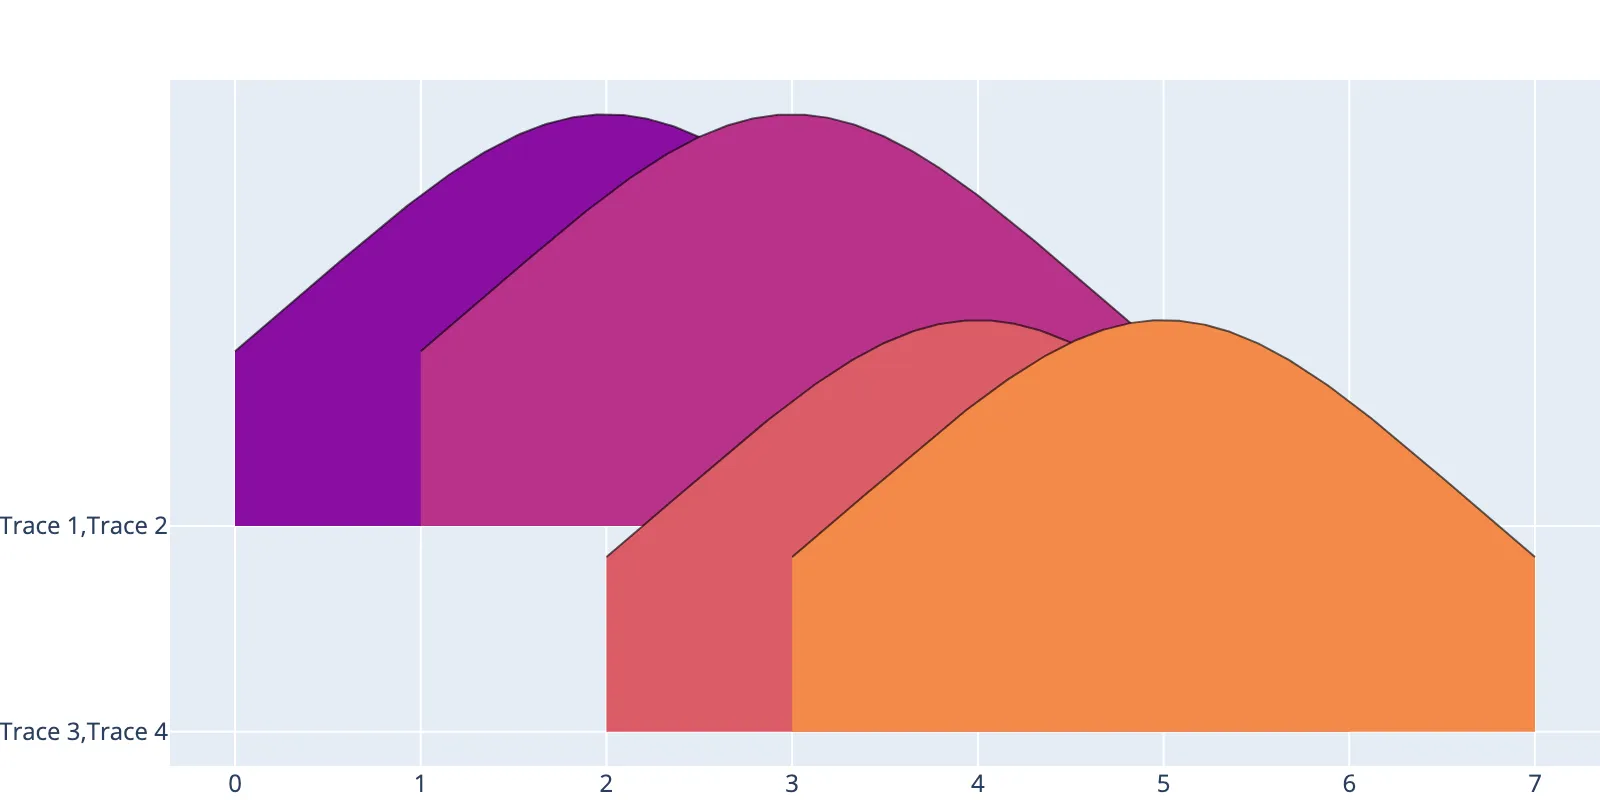
Samplestype represents the entire collection of samples that are to be plotted on a ridgeplot.It is a collection of
SamplesRowobjects. Each row is represented by aSamplesRowtype which, in turn, is a collection ofSamplesTraces which can be converted intoDensityTrace‘s by applying a kernel density estimation algorithm.Therefore, the
Samplestype can be converted into aDensitiestype by applying a kernel density estimation (KDE) algorithm to each trace.See
Densitiesfor more details.Example:
>>> samples = [
...     [                                # Row 1
...         [0, 1, 1, 2, 2, 2, 3, 3, 4], # Trace 1
...         [1, 2, 2, 3, 3, 3, 4, 4, 5], # Trace 2
...     ],
...     [                                # Row 2
...         [2, 3, 3, 4, 4, 4, 5, 5, 6], # Trace 3
...         [3, 4, 4, 5, 5, 5, 6, 6, 7], # Trace 4
...     ],
... ]
alias of
Collection[Collection[Collection[Union[int,integer,float,floating]]]]
- ridgeplot._types.ShallowSamples#
Shallow type for
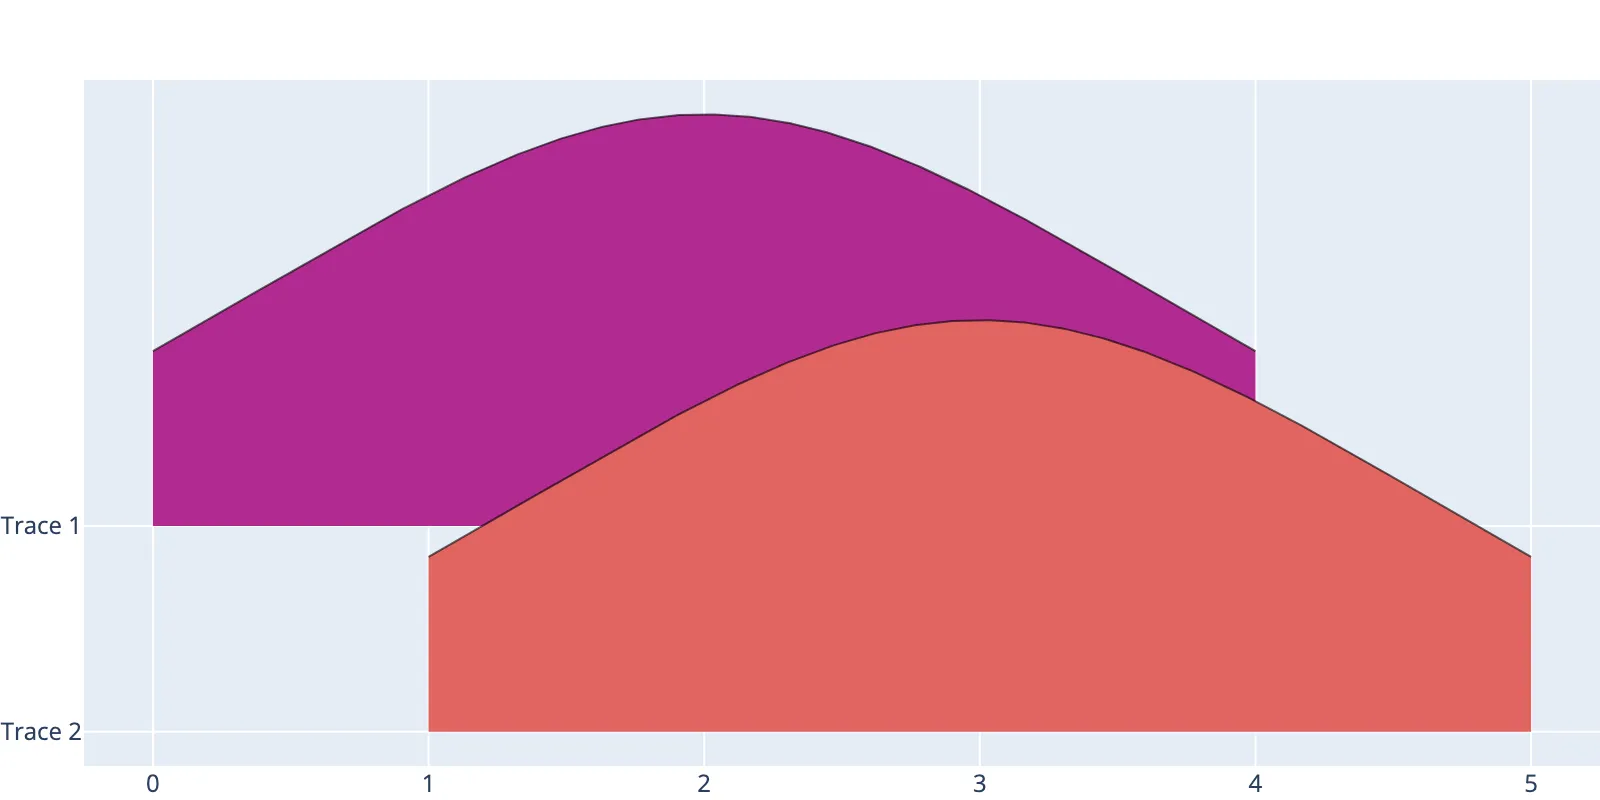
Sampleswhere each row of the ridgeplot contains only a single trace.Example:
>>> shallow_samples = [
...     [0, 1, 1, 2, 2, 2, 3, 3, 4], # Trace 1
...     [1, 2, 2, 3, 3, 3, 4, 4, 5], # Trace 2
... ]
alias of
Collection[Collection[Union[int,integer,float,floating]]]
- ridgeplot._types.is_shallow_samples(obj: ShallowSamples) Literal[True][source]#
- ridgeplot._types.is_shallow_samples(obj: Any) bool
Check if the given object is a
ShallowSamplestype.