ridgeplot: beautiful ridgeline plots in Python


![]()
![]()
![]()
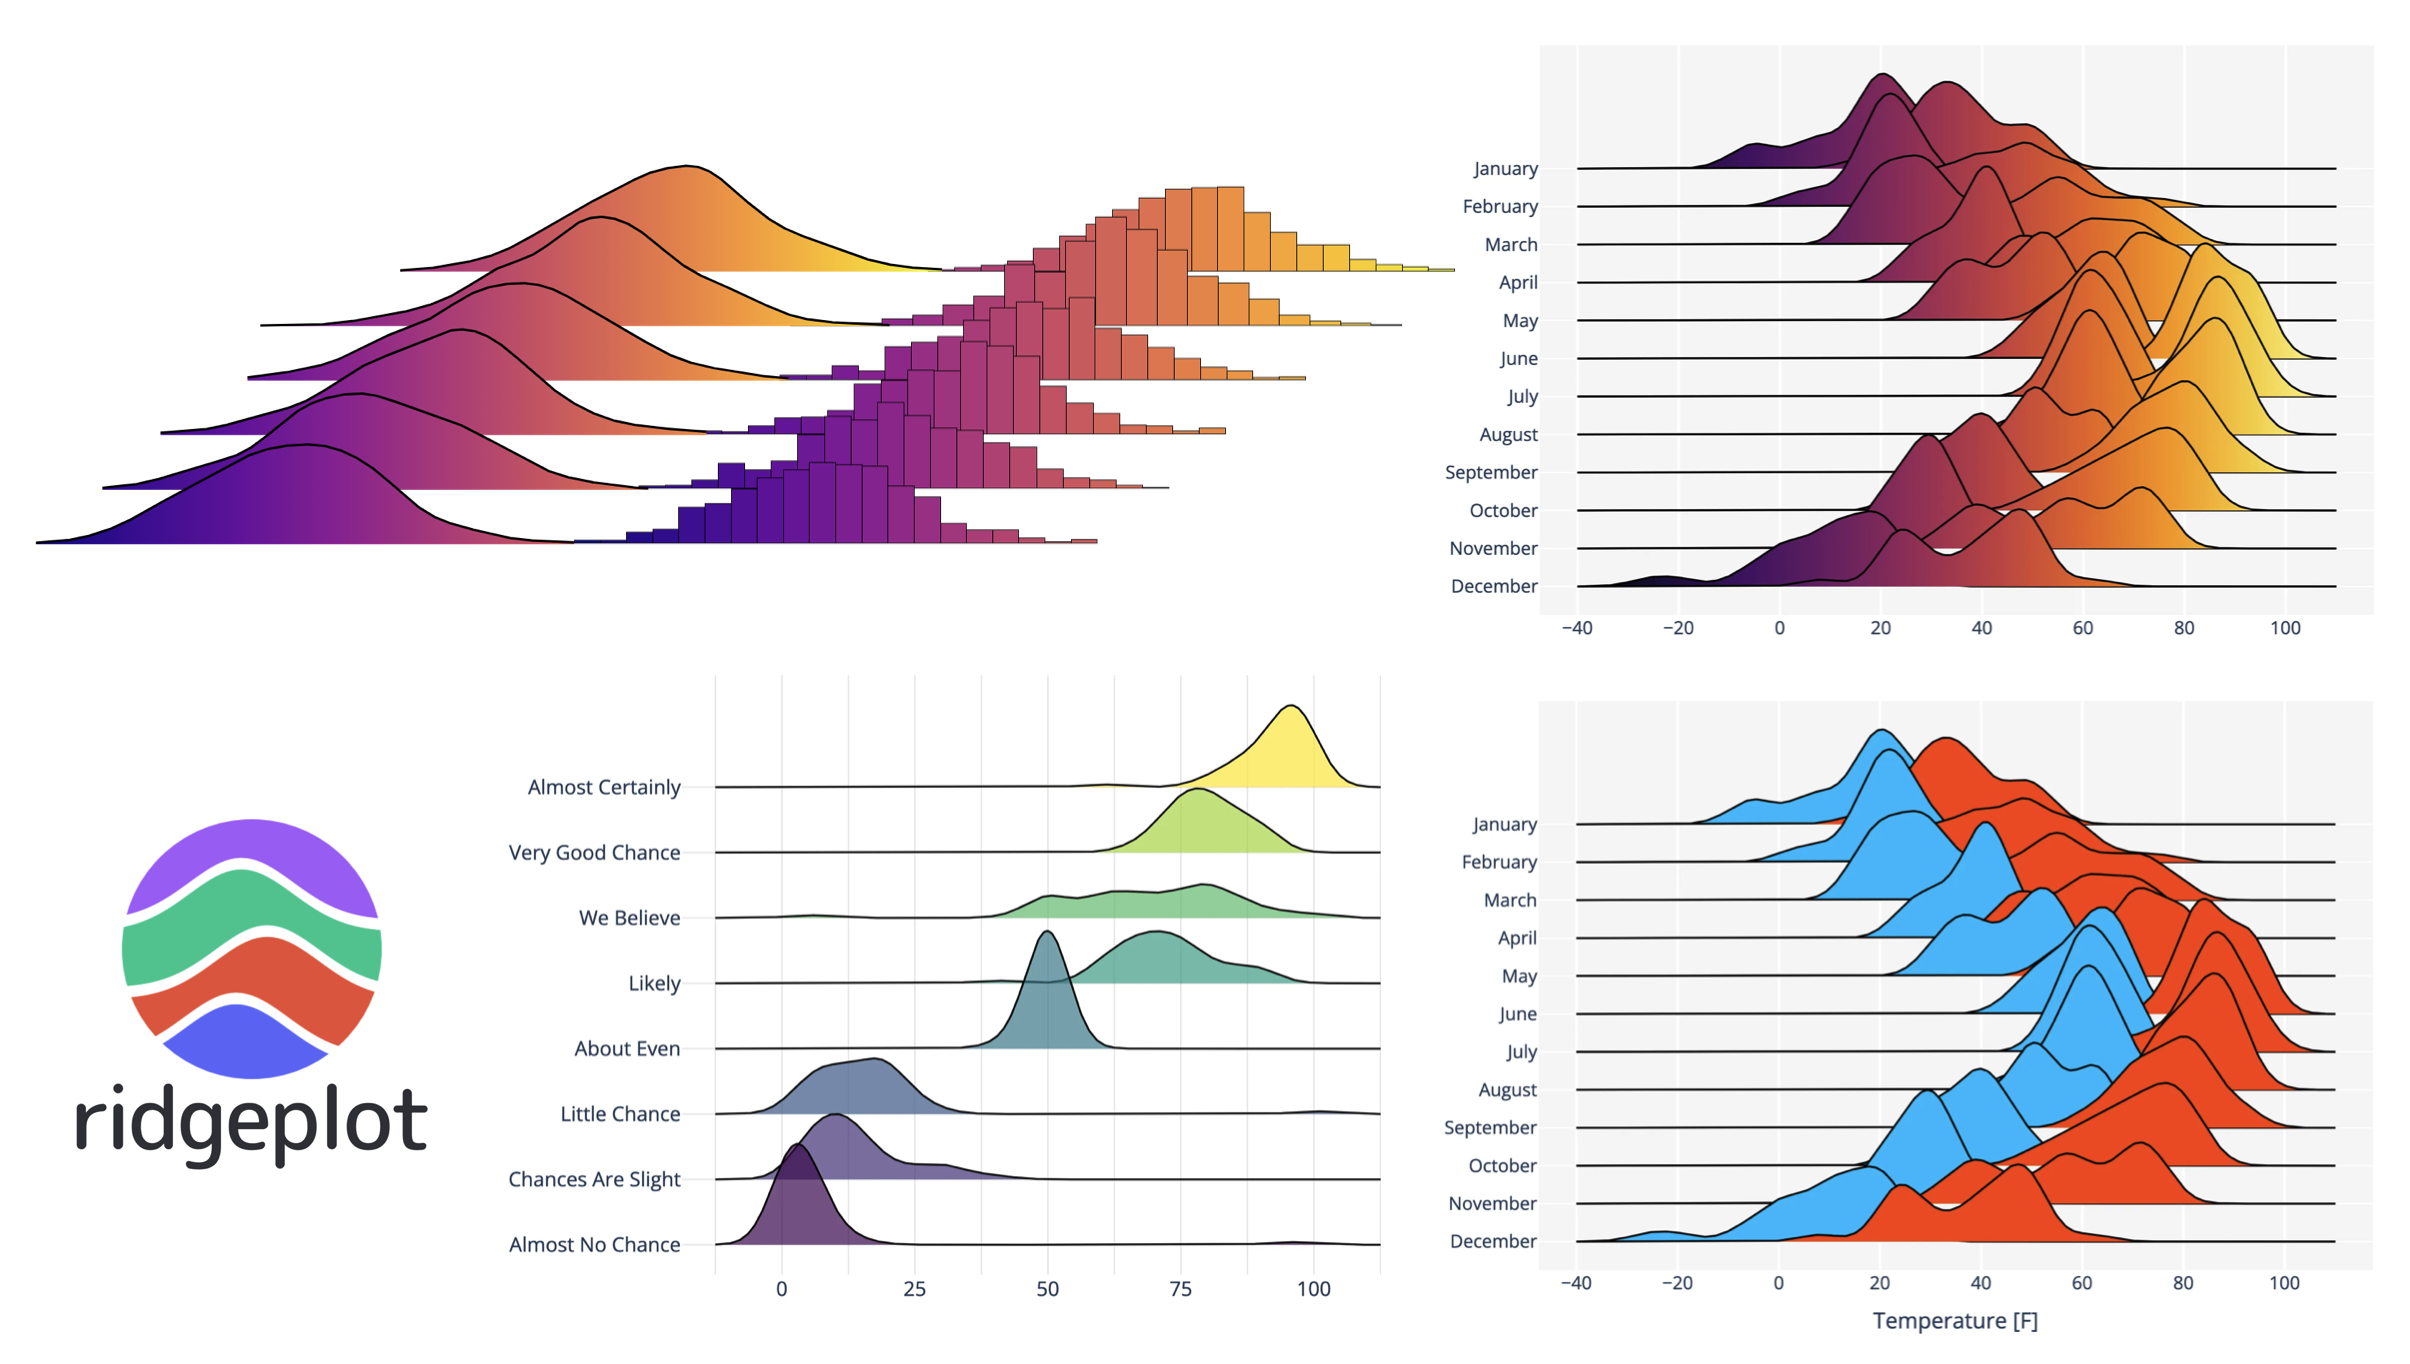
ridgeplot is a Python package that provides a simple interface for plotting beautiful and interactive ridgeline plots within the extensive Plotly ecosystem.
Installation
ridgeplot can be installed and updated from PyPi using pip:
pip install -U ridgeplot
For more information, see the installation guide.
Getting started
Take a look at the getting started guide, which provides a quick introduction to the ridgeplot library.
Basic example
For those in a hurry, here’s a very basic example on how to quickly get started with the ridgeplot() function.
import numpy as np
from ridgeplot import ridgeplot

my_samples = [np.random.normal(n, size=900) for n in range(6, 0, -2)]
fig = ridgeplot(samples=my_samples)
fig.show()